
Tracing
This guide describes how to create a sample Helidon SE project that can be used to run some basic examples using tracing with a Helidon SE application.
What You Need
For this 30 minute tutorial, you will need the following:
| Requirement | Description |
|---|---|
| Java 21 (Open JDK 21) | Helidon requires Java 21+ (25+ recommended). |
| Maven 3.8+ | Helidon requires Maven 3.8+. |
| Docker 18.09+ | If you want to build and run Docker containers. |
| Kubectl 1.16.5+ | If you want to deploy to Kubernetes, you need kubectl and a Kubernetes cluster. |
Prerequisite product versions for Helidon 4.4.0-SNAPSHOT
Verify Prerequisites:
java -version
mvn --version
docker --version
kubectl version
Setting JAVA_HOME:
# On Mac
export JAVA_HOME=`/usr/libexec/java_home -v 21`

# On Linux
# Use the appropriate path to your JDK
export JAVA_HOME=/usr/lib/jvm/jdk-21
Introduction
Distributed tracing is a critical feature of microservice-based applications, since it traces workflow both within a service and across multiple services. This provides insight to sequence and timing data for specific blocks of work, which helps you identify performance and operational issues. Helidon includes support for distributed tracing through its own API, backed by either through the OpenTelemetry API, or by OpenTracing API.
Tracing Concepts
This section explains a few concepts that you need to understand before you get started with tracing. In the context of this document, a service is synonymous with an application. A span is the basic unit of work done within a single service, on a single host. Every span has a name, starting timestamp, and duration. For example, the work done by a REST endpoint is a span. A span is associated to a single service, but its descendants can belong to different services and hosts. A trace contains a collection of spans from one or more services, running on one or more hosts. For example, if you trace a service endpoint that calls another service, then the trace would contain spans from both services. Within a trace, spans are organized as a directed acyclic graph (DAG) and can belong to multiple services, running on multiple hosts. Spans are automatically created by Helidon as needed during execution of the REST request.
Getting Started with Tracing
The examples in this guide demonstrate how to integrate tracing with Helidon, how to view traces, how to trace across multiple services, and how to integrate tracing with Kubernetes. All examples use the Jaeger backend and traces will be viewed using the Jaeger UI.
Create a Sample Helidon SE Project
Use the Helidon SE Maven archetype to create a simple project that can be used for the examples in this guide.
Run the Maven archetype:
mvn -U archetype:generate -DinteractiveMode=false \
    -DarchetypeGroupId=io.helidon.archetypes \
    -DarchetypeArtifactId=helidon-quickstart-se \
    -DarchetypeVersion=4.4.0-SNAPSHOT \
    -DgroupId=io.helidon.examples \
    -DartifactId=helidon-quickstart-se \
    -Dpackage=io.helidon.examples.quickstart.se
The project will be built and run from the helidon-quickstart-se directory:
cd helidon-quickstart-se
Set up Jaeger
First, run the Jaeger backend. Helidon communicates with this backend at runtime.
Run Jaeger within a docker container:
Enable Tracing in the Helidon Application
Update the pom.xml file and add the following OpenTelemetry dependency to the
<dependencies> section (not <dependencyManagement>). This will enable
Helidon to use OpenTelemetry at the default host and port, localhost:4317.
Add the following dependencies to pom.xml:
Helidon offers several tracing providers: OpenTelemetry, Zipkin, and Jaeger
(deprecated). All spans sent by Helidon to the backend need to be associated
with a service, assigned by the tracing.service setting in the example below.
Add the following lines to src/main/resources/application.yaml:
tracing:
  service: helidon-se-1
  tags:
    env: development
  enabled: true
  sampler-type: "const"
  sampler-param: 1
  log-spans: true
  propagation: b3
View Automatic Tracing of REST Endpoints
Tracing is part of Helidon’s observability support. By default, Helidon discovers any observability feature on the classpath and activates it automatically. In particular for tracing, Helidon adds a trace each time a client accesses a service endpoint. You can see these traces using the Jaeger UI once you build, run, and access your application without changing your application’s Java code.
Build and Access QuickStart
Build and run the application:
mvn clean package
java -jar target/helidon-quickstart-se.jar
Access the application:
curl http://localhost:8080/greet
Viewing Traces Using the Jaeger UI
The Jaeger backend provides a web-based UI at http://localhost:16686 where you can see a visual representation of the traces and spans within them.
- From the
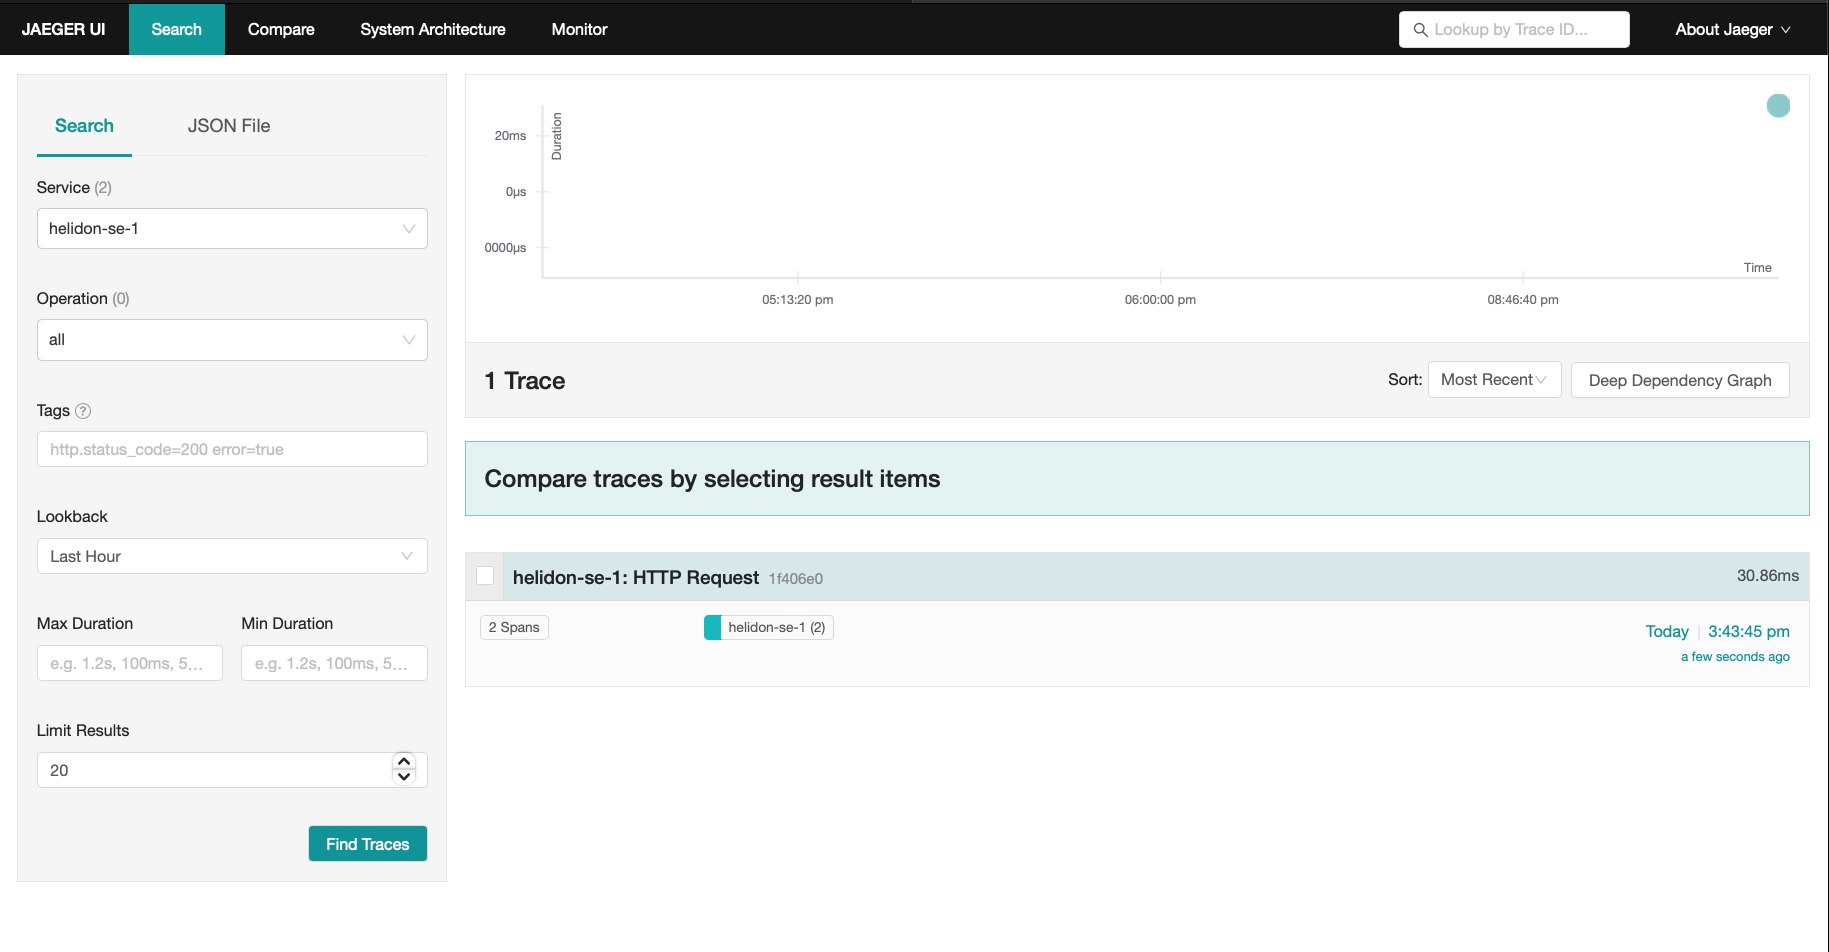
Servicedrop list selecthelidon-se-1. This name corresponds to thetracing.servicesetting you assigned in theapplication.yamlconfig file. - Click on the UI Find Traces button. Notice that you can change the look-back
time to restrict the trace list. You will see a trace for each
curlcommand you ran to access the application.
List of traces
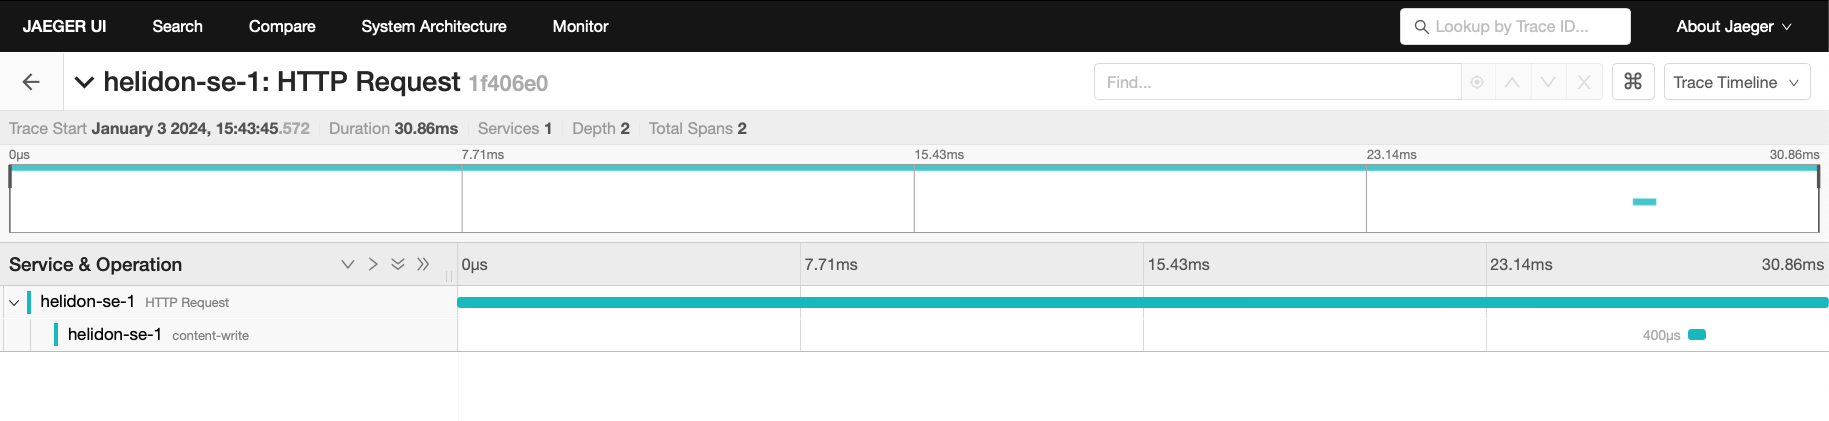
Click on a trace to see the trace detail page (shown below) which shows the
spans within the trace. You can clearly see the root span (HTTP Request) and
the single child span (content-write) along with the time over which each span
was active.
Trace detail page
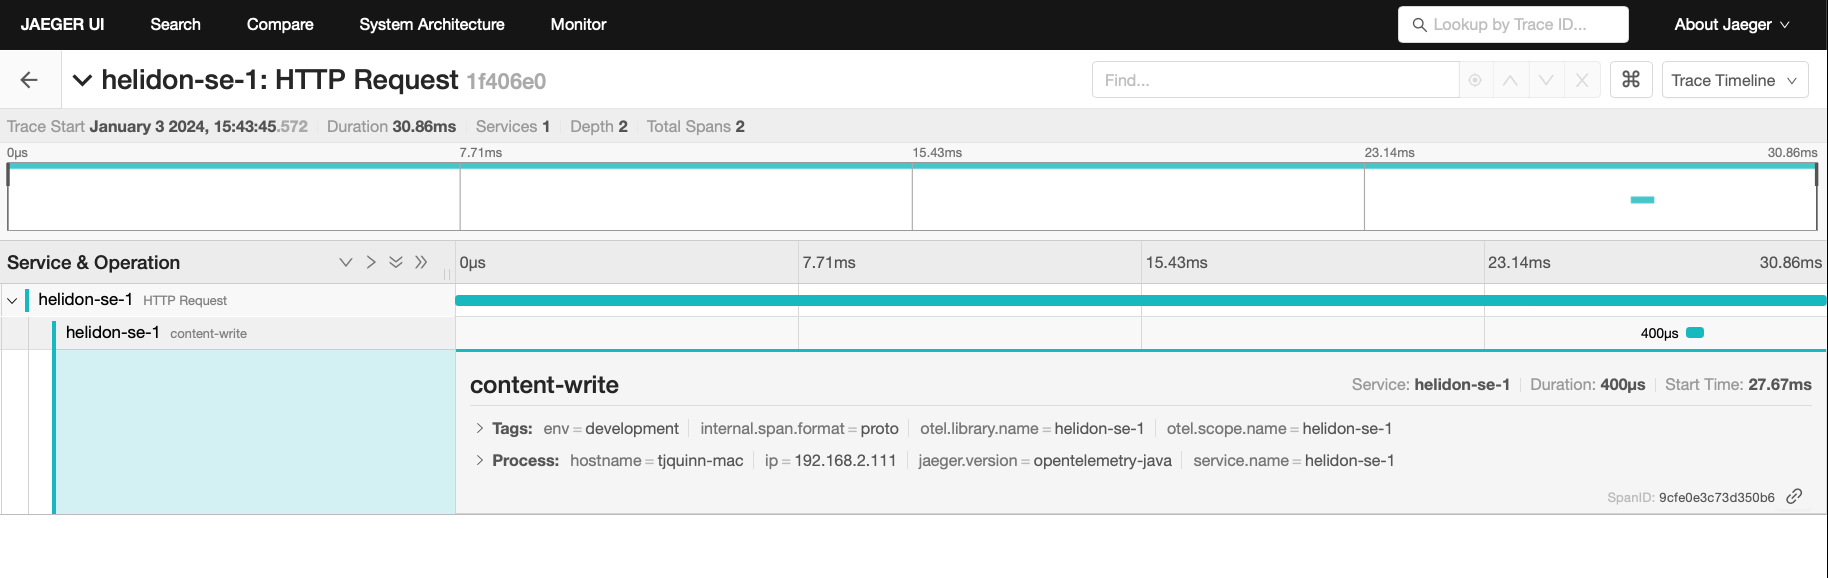
You can examine span details by clicking on the span row. Refer to the image below which shows the span details including timing information. You can see times for each space relative to the root span.
Span detail page
Adding a Custom Span
Your application can use the Helidon tracing API to create custom spans. The
following code replaces the generated getDefaultMessageHandler method to add a
custom span around the code which prepares the default greeting response. The
new custom span’s parent span is set to the one which Helidon automatically
creates for the REST endpoint.
Update the GreetService class, replacing the getDefaultMessageHandler method:
Build the application and run it:
mvn package
java -jar target/helidon-quickstart-se.jar
Run the curl command in a new terminal window and check the response:
curl http://localhost:8080/greet
{
  "message": "Hello World!"
}
Return to the main Jaeger UI screen and click Find Traces again. The new display
contains an additional trace, displayed first, for the most recent curl you
ran.
Expanded trace list
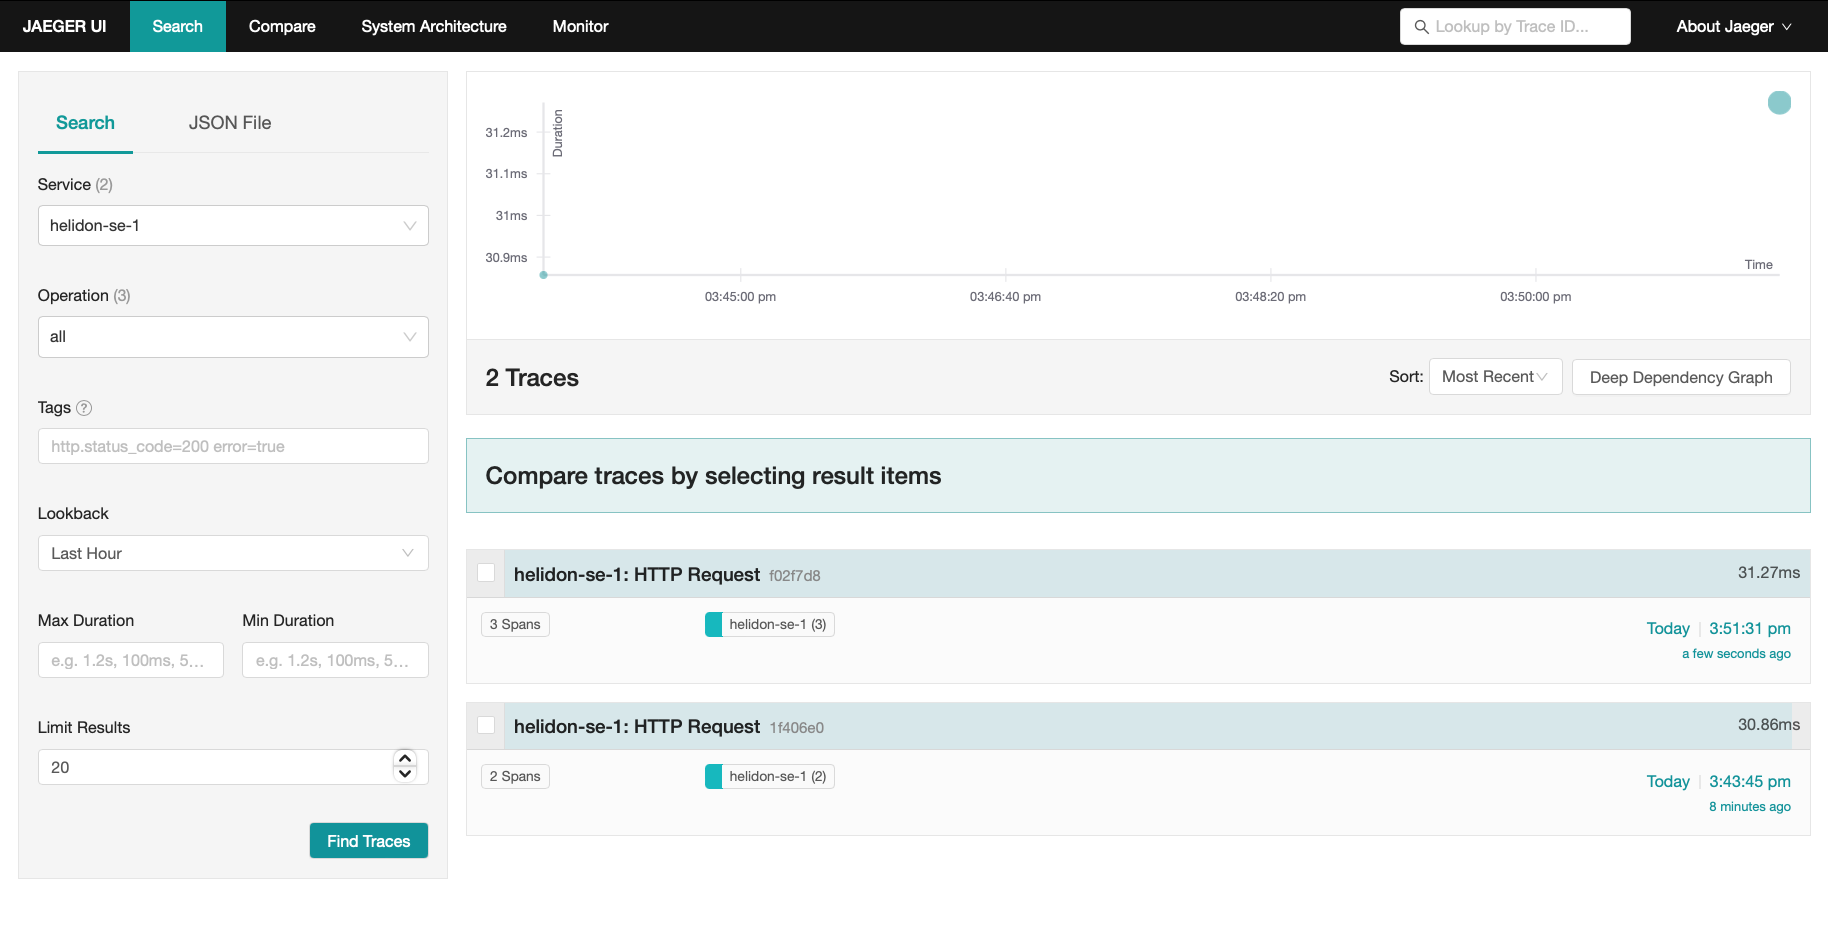
Notice that the top trace has three spans, not two as with the earlier trace. Click on the trace to see the trace details.
Trace details with custom span
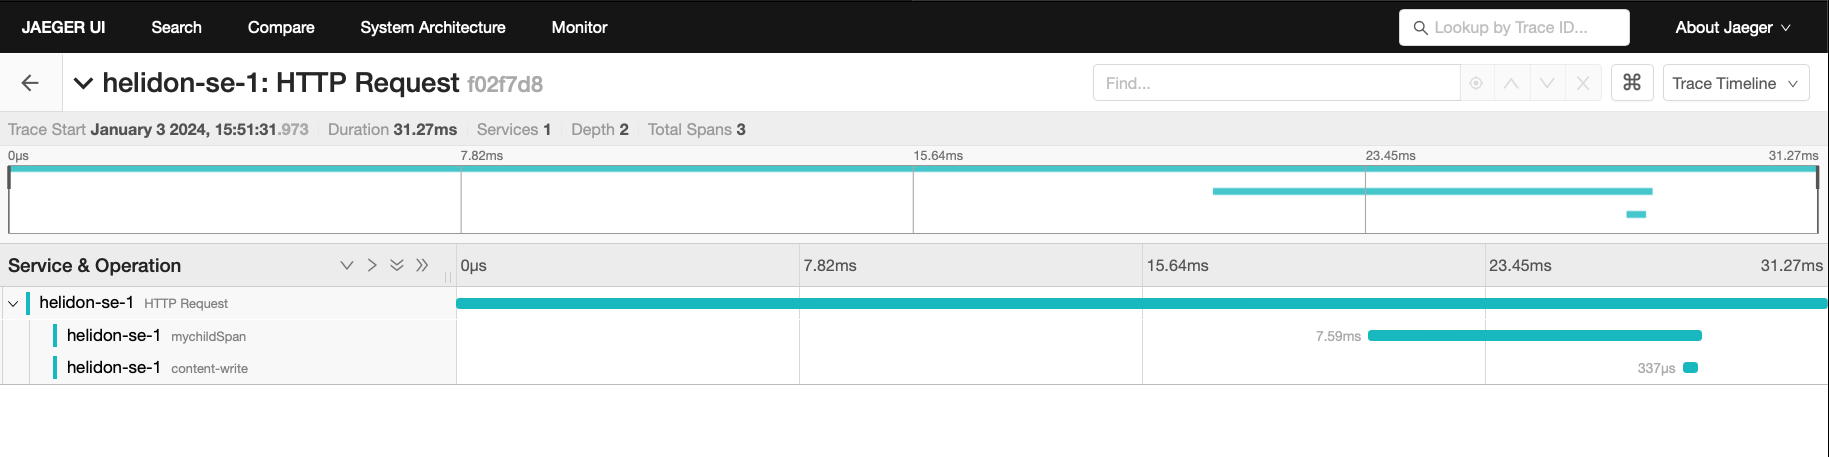
Note the row for mychildSpan--the custom span created by the added code.
Using Tracing Across Services
Helidon automatically traces across services if the services propagate span
information. This means a single trace can include spans from multiple services
and hosts. Helidon uses a SpanContext to propagate tracing information across
process boundaries. When you make client API calls, Helidon will internally call
OpenTelemetry APIs or OpenTracing APIs to propagate the SpanContext. There is
nothing you need to do in your application to make this work.
To demonstrate distributed tracing, create a second project where the server listens to on port 8081. Create a new directory to hold this new project, then do the following steps, similar to what you did at the start of this guide:
Create the Second Service
Run the Maven archetype:
mvn -U archetype:generate -DinteractiveMode=false \
    -DarchetypeGroupId=io.helidon.archetypes \
    -DarchetypeArtifactId=helidon-quickstart-se \
    -DarchetypeVersion=4.4.0-SNAPSHOT \
    -DgroupId=io.helidon.examples \
    -DartifactId=helidon-quickstart-se-2 \
    -Dpackage=io.helidon.examples.quickstart.se
The project is in the helidon-quickstart-se-2 directory:
cd helidon-quickstart-se-2
Add the following dependencies to pom.xml:
Replace src/main/resources/application.yaml with the following:
app:
  greeting: "Hello From SE-2"

tracing:
  service: helidon-se-2
  tags:
    env: development
  enabled: true
  sampler-type: "const"
  sampler-param: 1
  log-spans: true
  propagation: b3

server:
  port: 8081
  host: 0.0.0.0
Update the GreetService class. Replace the getDefaultMessageHandler method:
private void getDefaultMessageHandler(ServerRequest request,
                                      ServerResponse response) {

    var spanBuilder = Tracer.global().spanBuilder("getDefaultMessageHandler");
    request.context().get(SpanContext.class).ifPresent(spanBuilder::parent);
    Span span = spanBuilder.start();

    try (Scope scope = span.activate()) {
        sendResponse(response, "World");
        span.end();
    } catch (Throwable t) {
        span.end(t);
    }
}
Build the application, skipping unit tests; the unit tests check for the default greeting response which is now different in the updated config. Then run the application.
Build and run:
mvn package -DskipTests=true
java -jar target/helidon-quickstart-se-2.jar
Run the curl command in a new terminal window (notice the port is 8081):
curl http://localhost:8081/greet
Modify the First Service
Once you have validated that the second service is running correctly, you need to modify the original application to call it.
Add the following dependencies to pom.xml:
<dependencies>
  <dependency>
    <groupId>io.helidon.webclient</groupId>
    <artifactId>helidon-webclient</artifactId>
  </dependency>
  <dependency>
    <groupId>io.helidon.webclient</groupId>
    <artifactId>helidon-webclient-api</artifactId>
  </dependency>
  <dependency>
    <groupId>io.helidon.webclient</groupId>
    <artifactId>helidon-webclient-tracing</artifactId>
  </dependency>
  <dependency>
    <groupId>io.helidon.webclient</groupId>
    <artifactId>helidon-webclient-http1</artifactId>
    <scope>runtime</scope>
  </dependency>
</dependencies>
Make the following changes to the GreetFeature class.
- Add a
WebClientfield.
Add a private instance field (before the constructors):private WebClient webClient; - Add code to initialize the
WebClientfield.
Add the following code to the GreetService(Config) constructor:webClient = WebClient.builder() .baseUri("http://localhost:8081") .addService(WebClientTracing.create()) .build(); - Add a routing rule for the new endpoint
/outbound.
Add the following line in the routing method as the first .get invocation in the method:.get("/outbound", this::outboundMessageHandler); - Add a method to handle requests to
/outbound.
Add the following method:private void outboundMessageHandler(ServerRequest request, ServerResponse response) { var spanBuilder = Tracer.global().spanBuilder("outboundMessageHandler"); request.context().get(SpanContext.class).ifPresent(spanBuilder::parent); var span = spanBuilder.start(); try (Scope scope = span.activate()) { ClientResponseTyped<JsonObject> remoteResult = webClient.get() .path("/greet") .accept(MediaTypes.APPLICATION_JSON) .request(JsonObject.class); response.status(remoteResult.status()).send(remoteResult.entity()); span.end(); } catch (Exception e) { response.status(Status.INTERNAL_SERVER_ERROR_500).send(); span.end(e); } }
Stop the application if it is still running, rebuild and run it, then invoke the endpoint and check the response.
Build, run, and access the application:
Refresh the Jaeger UI trace listing page and notice that there is a trace across two services. Click on that trace to see its details.
Tracing across multiple services detail view
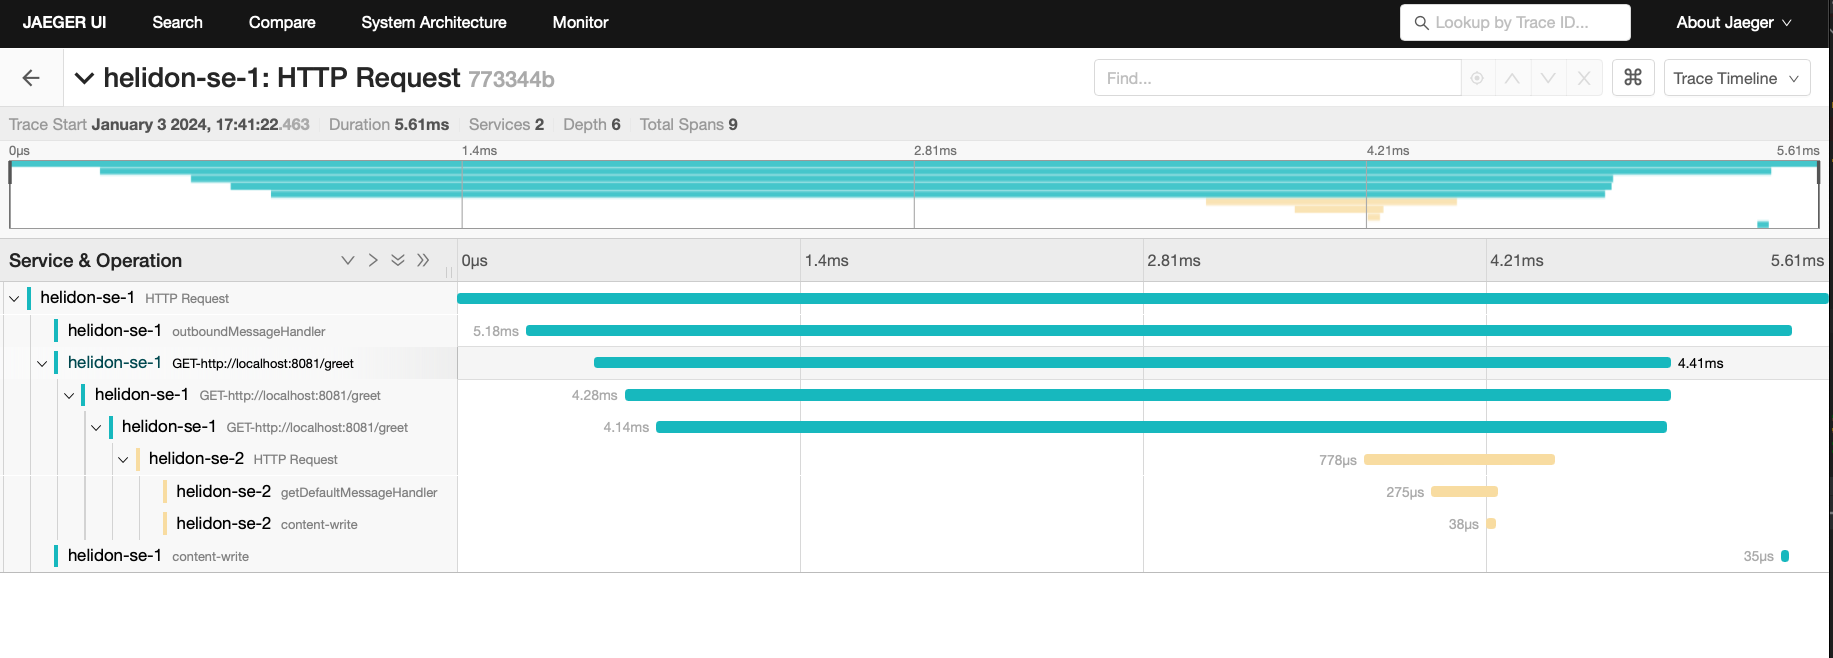
Note several things about the display:
- The top-level span
helidon-se-1 HTTP Requestincludes all the work across both services. helidon-se-1 outboundMessageHandleris the custom span you added to the first service/outboundendpoint code.helidon-se-1 GET-http://localhost:8080/greetcaptures the work theWebClientis doing in sending a request to the second service. Helidon adds these spans automatically to each outboundWebClientrequest.helidon-se-2 HTTP Requestrepresents the arrival of the request sent by the first service’sWebClientat the second service’s/greetendpoint.helidon-se-2 getDefaultMessageHandleris the custom span you added to the second service/greetendpoint code.
You can now stop your second service, it is no longer used in this guide.
Integration with Kubernetes
The following example demonstrates how to use Jaeger from a Helidon application running in Kubernetes.
Replace the tracing configuration in resources/application.yaml with the
following:
Stop the application and build the docker image for your application:
docker build -t helidon-tracing-se .
Deploy Jaeger into Kubernetes
Create the Kubernetes YAML specification, named jaeger.yaml, with the
following contents:
apiVersion: v1
kind: Service
metadata:
  name: jaeger
spec:
  ports:
    - port: 16686
      protocol: TCP
  selector:
    app: jaeger
---
kind: Pod
apiVersion: v1
metadata:
  name: jaeger
  labels:
    app: jaeger
spec:
  containers:
    - name: jaeger
      image: jaegertracing/all-in-one
      imagePullPolicy: IfNotPresent
      ports:
        - containerPort: 16686
Create the Jaeger pod and ClusterIP service:
kubectl apply -f ./jaeger.yaml
Create a Jaeger external server to view the UI and expose it on port 9142:
kubectl expose pod jaeger --name=jaeger-external --port=16687 --target-port=16686 --type=LoadBalancer
Navigate to http://localhost:16687/jaeger to validate that you can access Jaeger running in Kubernetes. It may take a few seconds before it is ready.
Deploy Your Helidon Application into Kubernetes
Create the Kubernetes YAML specification, named tracing.yaml, with the
following contents:
Create and deploy the application into Kubernetes:
kubectl apply -f ./tracing.yaml
Access Your Application and the Jaeger Trace
Get the application service information:
kubectl get service/helidon-tracing
Verify the tracing endpoint using port 31143, your port will likely be different:
curl http://localhost:31143/greet
{
  "message": "Hello World!"
}
Access the Jaeger UI at http://localhost:9412/jaeger and click on the refresh icon to see the trace that was just created.
Cleanup
You can now delete the Kubernetes resources just created during this example.
Delete the Kubernetes resources:
kubectl delete -f ./jaeger.yaml
kubectl delete -f ./tracing.yaml
kubectl delete service jaeger-external
docker rm -f jaeger
Responding to Span Lifecycle Events
Applications and libraries can register listeners to be notified at several moments during the lifecycle of every Helidon span:
- Before a new span starts
- After a new span has started
- After a span ends
- After a span is activated (creating a new scope)
- After a scope is closed
The next sections explain how you can write and add a listener and what it can
do. See the SpanListener Javadoc for more information.
Understanding What Listeners Do
A listener cannot affect the lifecycle of a span or scope it is notified about, but it can add tags and events and update the baggage associated with a span. Often a listener does additional work that does not change the span or scope such as logging a message.
When Helidon invokes the listener’s methods it passes proxies for the
Span.Builder, Span, and Scope arguments. These proxies limit the access
the listener has to the span builder, span, or scope, as summarized in the
following table. If a listener method tries to invoke a forbidden operation, the
proxy throws a SpanListener.ForbiddenOperationException
and Helidon then logs a WARNING message describing the invalid operation
invocation.
| Tracing type | Changes allowed |
|---|---|
Span.Builder | Add tags |
Span | Retrieve and update baggage, add events, add tags |
Scope | none |
Summary of Permitted Operations on Proxies Passed to Listeners
The following tables list specifically what operations the proxies permit.
| Method | Purpose | OK? |
|---|---|---|
build() | Starts the span. | - |
end methods | Ends the span. | - |
get() | Starts the span. | - |
kind(Kind) | Sets the "kind" of span (server, client, internal, etc.) | - |
parent(SpanContext) | Sets the parent of the span to be created from the builder. | - |
start() | Starts the span. | - |
start(Instant) | Starts the span. | - |
tag methods | Add a tag to the builder before the span is built. | ✓ |
unwrap(Class) | Cast the builder to the specified implementation type. | ✓ |
io.helidon.tracing.Span.Builder Operations
| Method | Purpose | OK? |
|---|---|---|
activate() | Makes the span "current", returning a Scope. | - |
addEvent methods | Associate a string (and optionally other info) with a span. | ✓ |
baggage() | Returns the Baggage instance associated with the span. | ✓ |
context() | Returns the SpanContext associated with the span. | ✓ |
status(Status) | Sets the status of the span. | - |
any tag method | Add a tag to the span. | ✓ |
unwrap(Class) | Cast the span to the specified implementation type. | ✓ |
io.helidon.tracing.Span Operations
| Method | Purpose | OK? |
|---|---|---|
close() | Close the scope. | - |
isClosed() | Reports whether the scope is closed. | ✓ |
io.helidon.tracing.Scope Operations
| Method | Purpose | OK? |
|---|---|---|
asParent(Span.Builder) | Sets this context as the parent of a new span builder. | ✓ |
baggage() | Returns Baggage instance associated with the span context. | ✓ |
spanId() | Returns the span ID. | ✓ |
traceId() | Returns the trace ID. | ✓ |
io.helidon.tracing.SpanContext Operations
Adding a Listener
Explicitly Registering a Listener on a Tracer
Create a SpanListener instance and invoke the Tracer#register(SpanListener)
method to make the listener known to that tracer.
Automatically Registering a Listener on all Tracer Instances
Helidon also uses Java service loading to locate listeners and register them
automatically on all Tracer objects. Follow these steps to add a listener
service provider.
- Implement the
SpanListenerinterface. - Declare your implementation as a service provider:
- Create the file
META-INF/services/io.helidon.tracing.SpanListenercontaining a line with the fully-qualified name of your class which implementsSpanListener. - If your service has a
module-info.javafile add the following line to it:provides io.helidon.tracing.SpanListener with <your-implementation-class>;
- Create the file
The SpanListener interface declares default no-op implementations for all the
methods, so your listener can implement only the methods it needs to.
Helidon invokes each listener’s methods in the following order:
| Method | When invoked |
|---|---|
starting(Span.Builder<?> spanBuilder) | Just before a span is started from its builder. |
started(Span span) | Just after a span has started. |
activated(Span span, Scope scope) | After a span has been activated, creating a new scope. A given span might never be activated; it depends on the code. |
closed(Span span, Scope scope) | After a scope has been closed. |
ended(Span span) | After a span has ended successfully. |
ended(Span span, Throwable t) | After a span has ended unsuccessfully. |
Order in which Helidon Invokes Listener Methods
Summary
This guide has demonstrated how to use the Helidon SE tracing feature with Jaeger. You have learned to do the following:
- Enable tracing within a service
- Use tracing with JAX-RS
- Use the Jaeger REST API and UI
- Use tracing across multiple services
- Integrate tracing with Kubernetes
Refer to the following references for additional information: