
Tracing
@Deprecated in Helidon. Please use the
Telemetry feature instead. The OpenTracing Specification
that MP OpenTracing is based on is no longer maintained. The MP OpenTracing
specification is no longer required by MicroProfile. The specification is
superseded by the MicroProfile Telemetry specification.Overview
Distributed tracing is a critical feature of microservice based applications, since it traces workflow both within a service and across multiple services. This provides insight to sequence and timing data for specific blocks of work, which helps you identify performance and operational issues. Helidon MP includes support for distributed tracing through the OpenTracing API. Tracing is integrated with WebServer and Security.
Maven Coordinates
To enable MicroProfile Tracing, either add a dependency on the
helidon-microprofile bundle or add the following dependency
to your project’s pom.xml (see Managing
Dependencies).
<dependency>
  <groupId>io.helidon.microprofile.tracing</groupId>
  <artifactId>helidon-microprofile-tracing</artifactId>
</dependency>
Usage
This section explains a few concepts that you need to understand before you get started with tracing.
- In the context of this document, a service is synonymous with an application.
- A span is the basic unit of work done within a single service, on a single host. Every span has a name, starting timestamp, and duration. For example, the work done by a REST endpoint is a span. A span is associated to a single service, but its descendants can belong to different services and hosts.
- A trace contains a collection of spans from one or more services, running on
one or more hosts. For example, if you trace a service endpoint that calls
another service, then the trace would contain spans from both services. Within
a trace, spans are organized as a directed acyclic graph (DAG) and can belong
to multiple services, running on multiple hosts. The OpenTracing Data Model
describes the details at The OpenTracing Semantic
Specification. Spans are automatically created by Helidon as
needed during execution of the REST request. Additional spans can be added
through MP annotation
@Tracedor through OpenTracing APIs.
Traced spans
The following table lists all spans traced by Helidon components:
| component | span name | description |
|---|---|---|
web-server | HTTP Request | The overall span of the Web Server from request initiation until response Note that in Zipkin the name is replaced with jax-rs span name if jax-rs tracing is used. |
web-server | content-read | Span for reading the request entity |
web-server | content-write | Span for writing the response entity |
security | security | Processing of request security |
security | security:atn | Span for request authentication |
security | security:atz | Span for request authorization |
security | security:response | Processing of response security |
security | security:outbound | Processing of outbound security |
jax-rs | A generated name | Span for the resource method invocation, name is generated from class and method name |
jax-rs | jersey-client-call | Span for outbound client call |
Some of these spans log to the span. These log events can be (in most cases)
configured:
| span name | log name | configurable | enabled by default | description |
|---|---|---|---|---|
HTTP Request | handler.class | YES | YES | Each handler has its class and event logged |
security | status | YES | YES | Logs either "status: PROCEED" or "status: DENY" |
security:atn | security.user | YES | NO | The username of the user if logged in |
security:atn | security.service | YES | NO | The name of the service if logged in |
security:atn | status | YES | YES | Logs the status of security response (such as SUCCESS) |
security:atz | status | YES | YES | Logs the status of security response (such as SUCCESS) |
security:outbound | status | YES | YES | Logs the status of security response (such as SUCCESS) |
There are also tags that are set by Helidon components. These are not configurable.
| span name | tag name | description |
|---|---|---|
HTTP Request | component | name of the component - helidon-webserver, or jaxrs when using MP |
HTTP Request | http.method | HTTP method of the request, such as GET, POST |
HTTP Request | http.status_code | HTTP status code of the response |
HTTP Request | http.url | The path of the request (for SE without protocol, host and port) |
HTTP Request | error | If the request ends in error, this tag is set to true, usually accompanied by logs with details |
security | security.id | ID of the security context created for this request (if security is used) |
jersey-client-call | http.method | HTTP method of the client request |
jersey-client-call | http.status_code | HTTP status code of client response |
jersey-client-call | http.url | Full URL of the request (such as http://localhost:8080/greet) |
Configuration
Enabling and Disabling Tracing
You can configure a custom service name using the tracing.service
configuration property. If this property is undefined, name is created from
JAX-RS Application name, or Helidon MP is used if no application is defined.
Configuration options
| Key | Type | Default | Description |
|---|---|---|---|
path | String | Path on the collector host to use when sending data to tracing collector | |
protocol | String | Protocol to use (such as http or https) to connect to tracing collector | |
boolean- | Map< | Tracer level tags that get added to all reported spans | |
port | Integer | Port to use to connect to tracing collector | |
service | String | Service name of the traced service | |
host | String | Host to use to connect to tracing collector | |
global | Boolean | true | When enabled, the created instance is also registered as a global tracer |
int- | Map< | Tracer level tags that get added to all reported spans | |
enabled | Boolean | true | When enabled, tracing will be sent |
tags | Map< | Tracer level tags that get added to all reported spans |
To disable Helidon tracing for web server and security:
tracing.components.web-server.enabled=false
tracing.components.security.enabled=false
To disables MP Tracing as by specification:
mp.opentracing.server.skip-pattern=.*
Tracing configuration can be defined in application.yaml file.
tracing:
  paths:
    - path: "/favicon.ico"
      enabled: false
    - path: "/metrics"
      enabled: false
    - path: "/health"
      enabled: false
  components:
    web-server:
      spans:
        - name: "HTTP Request"
          logs:
            - name: "content-write"
              enabled: false
Controlling Tracing Output
For Web Server we have a path based support for configuring tracing, in addition to the configuration described above.
Configuration of path can use any path string supported by the Web Server. The configuration itself has the same possibilities as traced configuration described above. The path specific configuration will be merged with global configuration (path is the "newer" configuration, global is the "older")
Renaming top level span using request properties
To have a nicer overview in search pane of a tracer, you can customize the top-level span name using configuration.
Example:
Configuration properties:
tracing.components.web-server.spans.0.name="HTTP Request"
tracing.components.web-server.spans.0.new-name: "HTTP %1$s %2$s"
This is supported ONLY for the span named "HTTP Request" on component "web-server".
Parameters provided:
- Method - HTTP method
- Path - path of the request (such as '/greet')
- Query - query of the request (may be null)
Examples
The examples in this guide demonstrate how to integrate tracing with Helidon, how to view traces, how to trace across multiple services, and how to integrate tracing with Kubernetes. All examples use Jaeger and traces will be viewed using both the Jaeger UI.
Set up Jaeger
First, you need to run the Jaeger tracer. Helidon will communicate with this tracer at runtime.
Run Jaeger within a docker container, then check the Jaeger server working:
Check the Jaeger server by opening http://localhost:16686/search in a browser.
Trace Across Services
Helidon automatically traces across services as long as the services use the
same tracer, for example, the same instance of Jaeger. This means a single trace
can include spans from multiple services and hosts. OpenTracing uses a
SpanContext to propagate tracing information across process boundaries. When
you make client API calls, Helidon will internally call OpenTracing APIs to
propagate the SpanContext. There is nothing you need to do in your application
to make this work.
To demonstrate distributed tracing, you will need to create a second project, where the server listens on port 8081. Create a new root directory to hold this new project, then do the following steps, similar to what you did at the start of this guide:
Create a second service
Run the Maven archetype:
mvn -U archetype:generate -DinteractiveMode=false \
    -DarchetypeGroupId=io.helidon.archetypes \
    -DarchetypeArtifactId=helidon-quickstart-mp \
    -DarchetypeVersion=4.4.0-SNAPSHOT \
    -DgroupId=io.helidon.examples \
    -DartifactId=helidon-quickstart-mp-2 \
    -Dpackage=io.helidon.examples.quickstart.mp
The project will be built and run from the helidon-quickstart-mp directory:
cd helidon-quickstart-mp-2
Add the following dependency to pom.xml:
<dependency>
  <groupId>io.helidon.tracing.providers</groupId>
  <artifactId>helidon-tracing-providers-jaeger</artifactId>
</dependency>
Replace META-INF/microprofile-config.properties with the following:
app.greeting=Hello From MP-2
tracing.service=helidon-mp-2

# MicroProfile server properties
server.port=8081
Build the application, skipping unit tests, then run it:
mvn package -DskipTests=true
java -jar target/helidon-quickstart-mp-2.jar
Run the curl command in a new terminal window and check the response (notice the port is 8081):
curl http://localhost:8081/greet
Response body:
Modify the first service
Once you have validated that the second service is running correctly, you need to modify the original application to call it.
Replace the GreetResource class with the following code:
Response body:
Refresh the Jaeger UI trace listing page and notice that there is a trace across two services.
Tracing across multiple services detail view
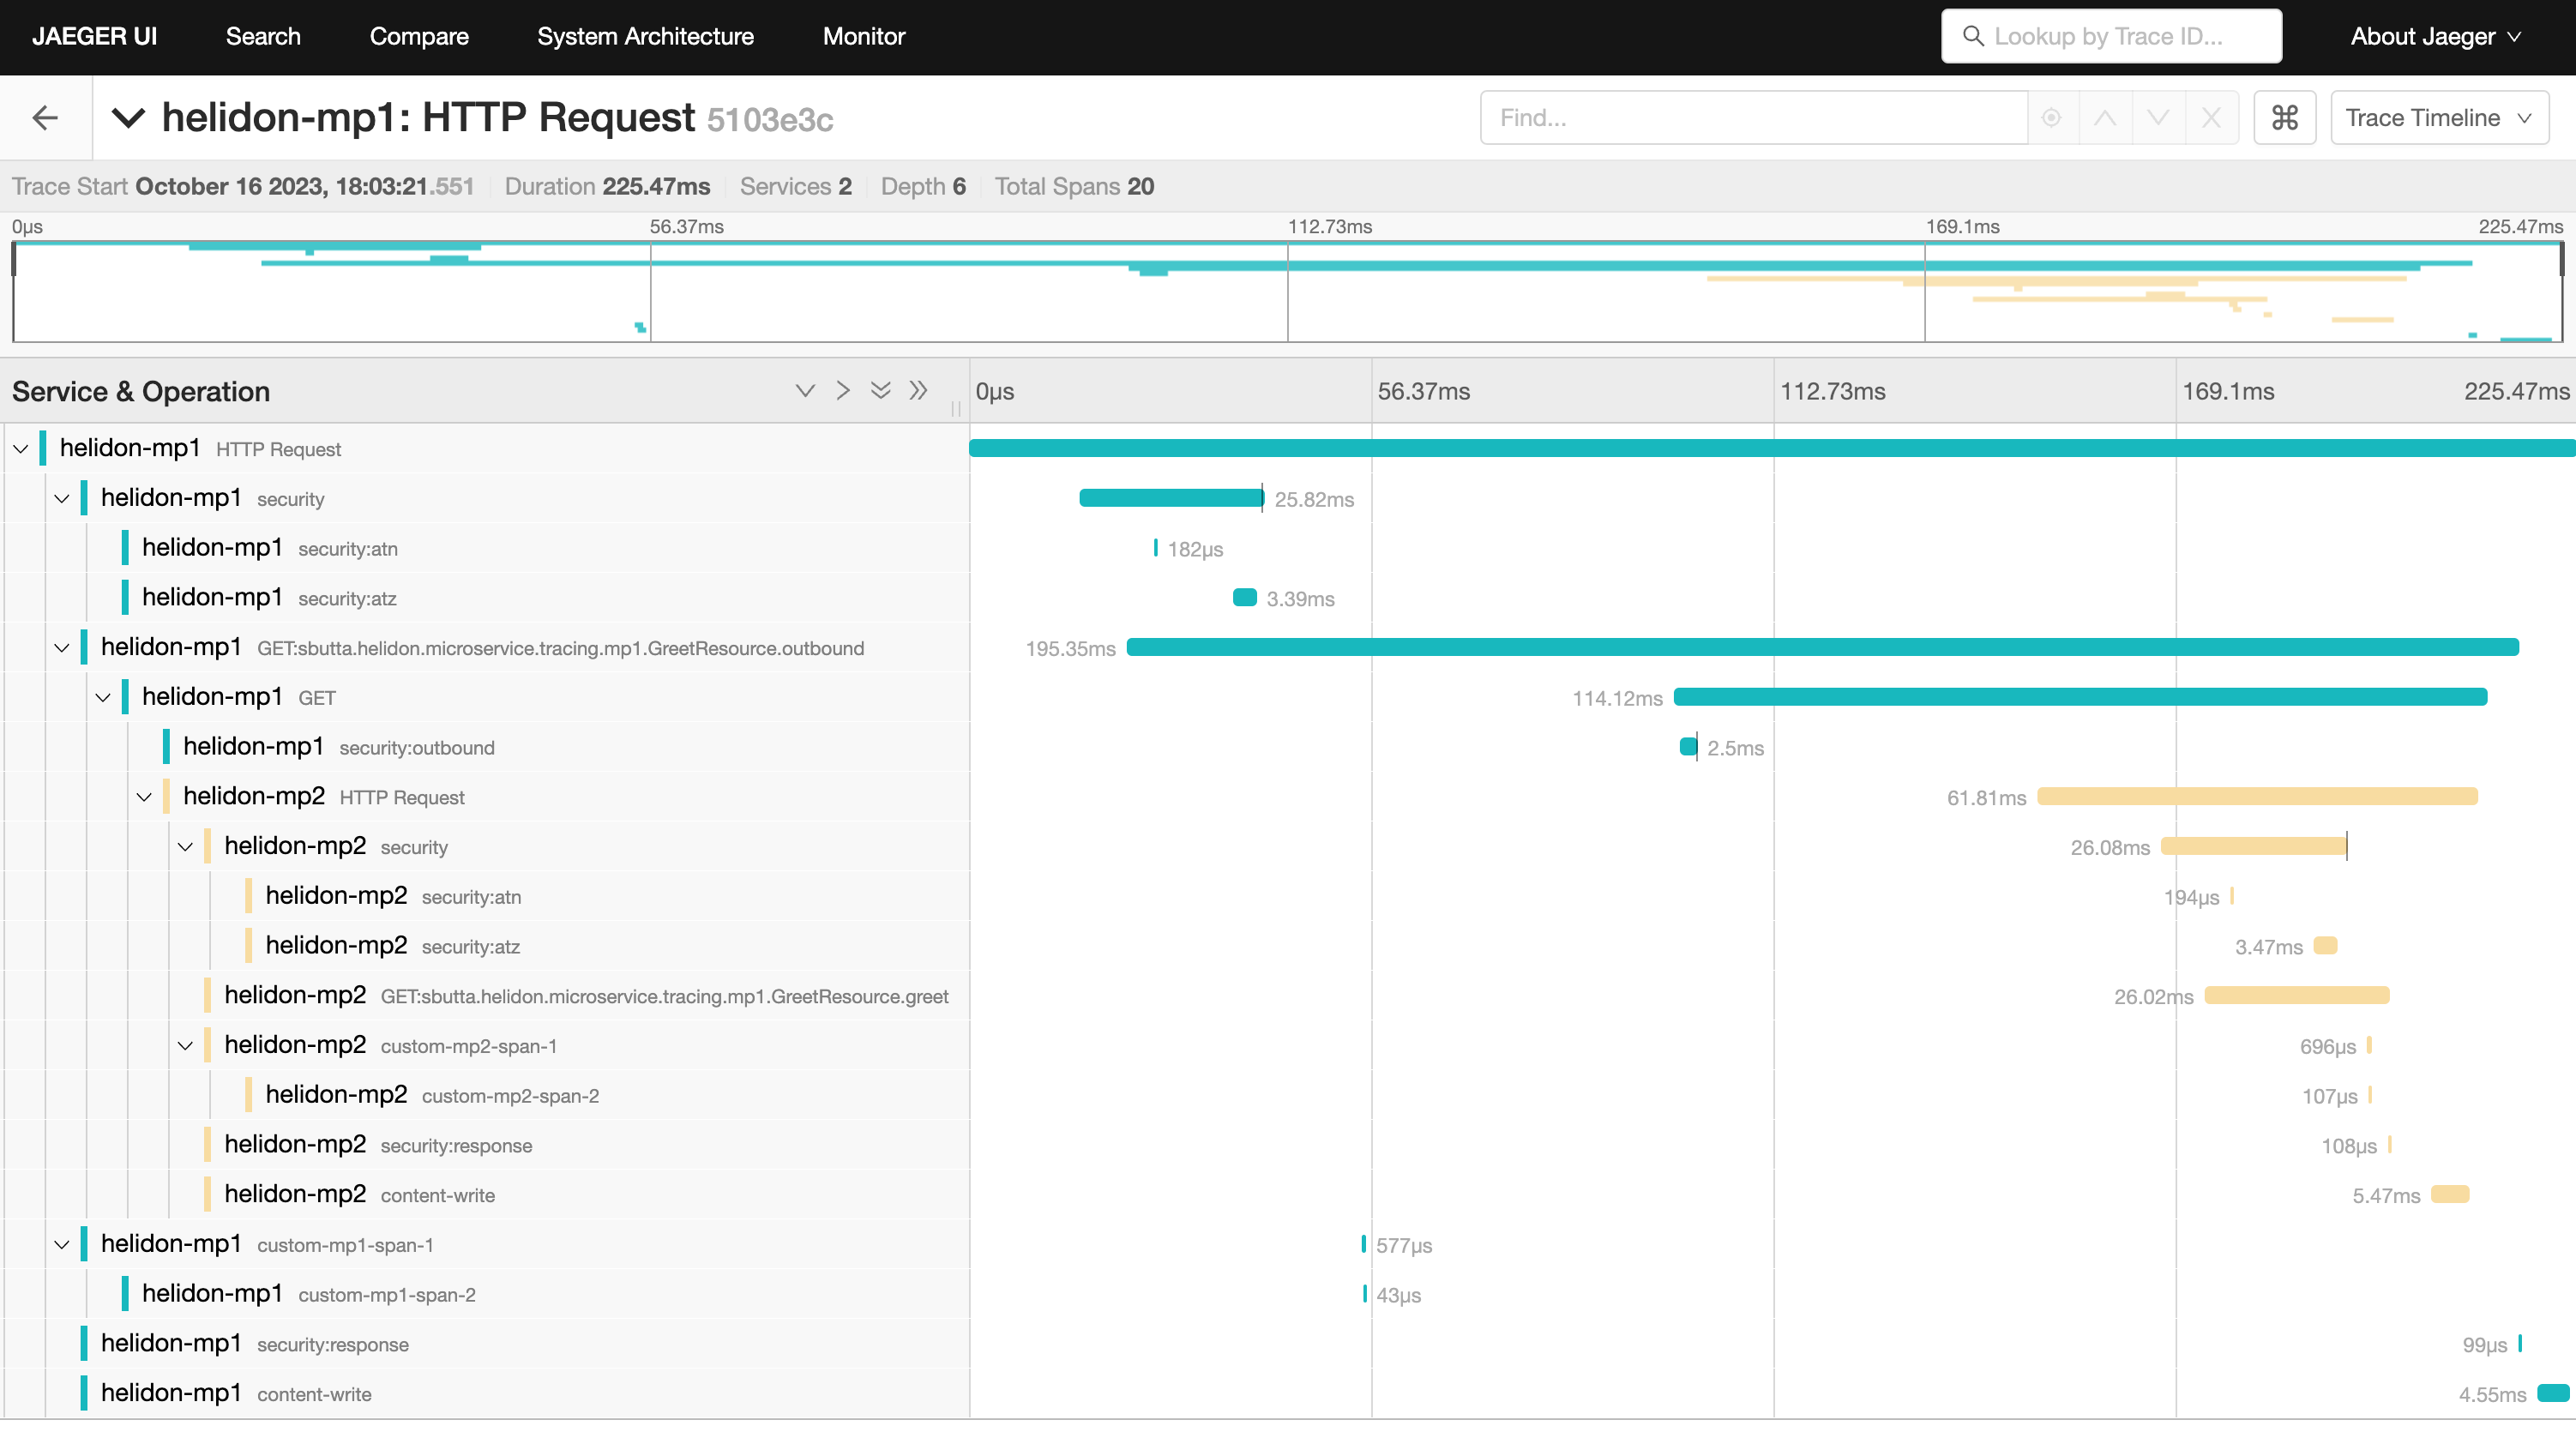
In the image above, you can see that the trace includes spans from two services.
You will notice there is a gap before the sixth span, which is a get
operation. This is a one-time client initialization delay. Run the /outbound
curl command again and look at the new trace to see that the delay no longer
exists.
You can now stop your second service, it is no longer used in this guide.
Kubernetes Integration
The following example demonstrates how to use Jaeger from a Helidon application running in Kubernetes.
Update application.yaml:
tracing:
  host: "jaeger"
Stop the application and build the docker image for your application:
docker build -t helidon-tracing-mp .
Deploy Jaeger into Kubernetes
Create the Kubernetes YAML specification, named jaeger.yaml, with the
following contents:
apiVersion: v1
kind: Service
metadata:
  name: jaeger
spec:
  ports:
    - port: 16686
      protocol: TCP
  selector:
    app: jaeger
---
kind: Pod
apiVersion: v1
metadata:
  name: jaeger
  labels:
    app: jaeger
spec:
  containers:
    - name: jaeger
      image: jaegertracing/all-in-one
      imagePullPolicy: IfNotPresent
      ports:
        - containerPort: 16686
Create the Jaeger pod and ClusterIP service:
kubectl apply -f ./jaeger.yaml
Create a Jaeger external server and expose it on port 9142:
Navigate to http://localhost:16687/search to validate that you can access Jaeger running in Kubernetes. It may take a few seconds before it is ready.
Deploy Your Helidon Application into Kubernetes
Create the Kubernetes YAML specification, named tracing.yaml, with the
following contents:
Create and deploy the application into Kubernetes:
kubectl apply -f ./tracing.yaml
Access Your Application and the Jaeger Trace
Get the application service information:
kubectl get service/helidon-tracing
Verify the tracing endpoint using port 31143, your port will likely be different:
curl http://localhost:31143/greet
{
  "message": "Hello World!"
}
Access the Jaeger UI at http://localhost:16687/search and click on the refresh icon to see the trace that was just created.
Cleanup
You can now delete the Kubernetes resources that were just created during this example.
Delete the Kubernetes resources:
kubectl delete -f ./jaeger.yaml
kubectl delete -f ./tracing.yaml
kubectl delete service jaeger-external
docker rm -f jaeger
Creating custom spans
Helidon MP fully supports MicroProfile OpenTracing. You can add custom spans
using @Traced annotation on methods of CDI beans.
Note for invoking methods on same class: If you invoke a method on the same
class, @Traced annotation would be ignored, as it is not invoked through a CDI
proxy and as such cannot be intercepted. To make sure @Traced is honored, use
it on JAX-RS resource methods and on CDI bean methods used from other beans.
Trace propagation across services
Automated trace propagation is supported currently only with Jersey client.
Tracing propagation works automatically as long as you run within the scope of Helidon MP and use Helidon components to invoke external services.
Manual handling of traces in Jersey Client
There is an option to provide SpanContext programmatically (such as when
writing a command line application that starts the span manually).
You can either configure the span context as the active span, or explicitly define it as client property.
Tracing propagation with Jersey client:
Response response = client.target(serviceEndpoint)
        .request()
        // tracer should be provided unless available as GlobalTracer
        .property(TRACER_PROPERTY_NAME, tracer)
        .property(CURRENT_SPAN_CONTEXT_PROPERTY_NAME, spanContext)
        .get();
Jaeger Tracing
<dependency>
  <groupId>io.helidon.tracing</groupId>
  <artifactId>helidon-tracing-providers-jaeger</artifactId>
</dependency>
Configuration options
| Key | Type | Default | Description |
|---|---|---|---|
propagation | List< | JAEGER | Add propagation format to use |
sampler- | Number | 1 | The sampler parameter (number) |
schedule- | Duration | PT5S | Schedule Delay of exporter requests |
span- | Span | batch | Span Processor type used |
max- | Integer | 512 | Maximum Export Batch Size of exporter requests |
trusted- | Resource | Trusted certificates in PEM format | |
exporter- | Duration | PT10S | Timeout of exporter requests |
sampler- | Sampler | CONSTANT | Sampler type |
private- | Resource | Private key in PEM format | |
client- | Resource | Certificate of client in PEM format | |
max- | Integer | 2048 | Maximum Queue Size of exporter requests |
Configuration Example
The following is an example of a Jaeger configuration, specified in the YAML format.
tracing:
    service: "helidon-full-http"
    protocol: "https"
    host: "jaeger"
    port: 14240
Jaeger Tracing Metrics
As the Jaeger Tracing section describes, you can use Jaeger tracing in your Helidon application.
Zipkin Tracing
<dependency>
  <groupId>io.helidon.tracing.providers</groupId>
  <artifactId>helidon-tracing-providers-zipkin</artifactId>
</dependency>
Configuration options
| Key | Type | Default | Description |
|---|---|---|---|
api- | Version | V2 | Version of Zipkin API to use |
Configuration Example
The following is an example of a Zipkin configuration, specified in the YAML format.
tracing:
  zipkin:
    service: "helidon-service"
    protocol: "https"
    host: "zipkin"
    port: 9987
    api-version: 1
    # this is the default path for API version 2
    path: "/api/v2/spans"
    tags:
      tag1: "tag1-value"
      tag2: "tag2-value"
    boolean-tags:
      tag3: true
      tag4: false
    int-tags:
      tag5: 145
      tag6: 741
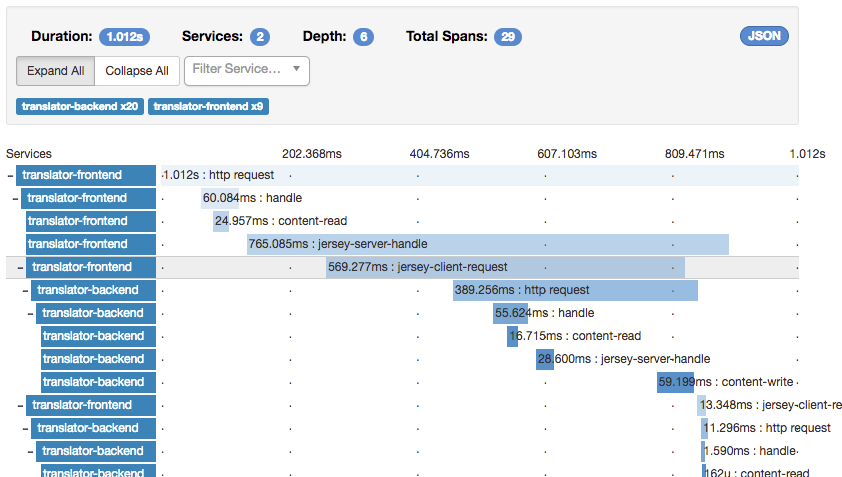
Example of Zipkin trace:
OpenTelemetry Tracing
Helidon supports configuration of OpenTelemetry and OpenTelemetry tracing in two primary ways: using tracing or using telemetry. The Helidon MP Telemetry doc page describes how to use Helidon’s support for MicroProfile Telemetry to control OpenTelemetry.
Avoid using both the OpenTelemetry tracing support described here and support for MicroProfile Telemetry as the results are unpredictable.
telemetry and tracing, Helidon uses the
telemetry settings. Specifying both does not confuse Helidon but it might
confuse users.Dependency for OpenTelemetry support using tracing:
<dependency>
  <groupId>io.helidon.tracing.providers</groupId>
  <artifactId>helidon-tracing-providers-opentelemetry</artifactId>
</dependency>
Configuration options
| Key | Type | Default | Description |
|---|---|---|---|
export- | Duration | PT10S | Maximum time a transmission can be in progress before being cancelled |
sampler- | Double | 1. | Parameter value used by the selected sampler; interpretation depends on the sampler type |
boolean- | Map< | Tracer-level tags with boolean values added to all reported spans | |
span- | Span | BATCH | Type of span processor for accumulating spans before transmission to the tracing collector |
trusted- | Resource | Trusted certificates for connecting to the tracing collector | |
sampler- | Extended | CONSTANT | Type of sampler for collecting spans |
global | Boolean | true | Whether to create and register a tracer as the global tracer |
exporter- | Otlp | GRPC | Type of OTLP exporter to use for pushing span data |
propagators | List< | Context propagators | |
client- | Resource | Client certificate for connecting securely to the tracing collector | |
uri | URI | URI for the collector to which to send tracing data | |
enabled | Boolean | true | Whether to enable tracing |
tags | Map< | Tracer-level tags with String values added to all reported spans | |
path | String | Path at the collector host and port used when sending trace data to the collector | |
protocol | String | Protocol (such as http or https) used in connecting to the tracing collector | |
port | Integer | Port used in connecting to the tracing collector | |
schedule- | Duration | PT5S | Delay between consecutive transmissions to the tracing collector (batch processing) |
max- | Integer | 512 | Maximum number of spans grouped for transmission together; typically does not exceed #max (batch processing) |
service | String | Service name of the traced service | |
host | String | Host used in connecting to the tracing collector | |
private- | Resource | Private key for connecting securely to the tracing collector | |
int- | Map< | Tracer level tags with integer values added to all reported spans | |
max- | Integer | 2048 | Maximum number of spans retained before discarding any not sent to the tracing collector (batch processing) |
Configuration Example
By default, Helidon tracing support for OpenTelemetry uses OpenTelemetry’s OTLP
gRPC exporter. Alternatively, you can choose to use OpenTelemetry’s HTTP
exporter using protobuf by setting exporter-type to http/proto. To use other
exporters OpenTelemetry offers, use the Helidon telemetry configuration
instead of tracing.
Span Lifecycle
Events
Applications and libraries can register listeners to be notified at several moments during the lifecycle of every Helidon span:
- Before a new span starts
- After a new span has started
- After a span ends
- After a span is activated (creating a new scope)
- After a scope is closed
The next sections explain how you can write and add a listener and what it can
do. See the SpanListener Javadoc for more information.
Listeners
A listener cannot affect the lifecycle of a span or scope it is notified about, but it can add tags and events and update the baggage associated with a span. Often a listener does additional work that does not change the span or scope such as logging a message.
When Helidon invokes the listener’s methods it passes proxies for the
Span.Builder, Span, and Scope arguments. These proxies limit the access
the listener has to the span builder, span, or scope, as summarized in the
following table. If a listener method tries to invoke a forbidden operation, the
proxy throws a SpanListener.ForbiddenOperationException
and Helidon then logs a WARNING message describing the invalid operation
invocation.
| Tracing type | Changes allowed |
|---|---|
Span.Builder | Add tags |
Span | Retrieve and update baggage, add events, add tags |
Scope | none |
Summary of Permitted Operations on Proxies Passed to Listeners
The following tables list specifically what operations the proxies permit.
| Method | Purpose | OK? |
|---|---|---|
build() | Starts the span. | - |
end methods | Ends the span. | - |
get() | Starts the span. | - |
kind(Kind) | Sets the "kind" of span (server, client, internal, etc.) | - |
parent(SpanContext) | Sets the parent of the span to be created from the builder. | - |
start() | Starts the span. | - |
start(Instant) | Starts the span. | - |
tag methods | Add a tag to the builder before the span is built. | ✓ |
unwrap(Class) | Cast the builder to the specified implementation type. | ✓ |
io.helidon.tracing.Span.Builder Operations
| Method | Purpose | OK? |
|---|---|---|
activate() | Makes the span "current", returning a Scope. | - |
addEvent methods | Associate a string (and optionally other info) with a span. | ✓ |
baggage() | Returns the Baggage instance associated with the span. | ✓ |
context() | Returns the SpanContext associated with the span. | ✓ |
status(Status) | Sets the status of the span. | - |
any tag method | Add a tag to the span. | ✓ |
unwrap(Class) | Cast the span to the specified implementation type. | ✓ |
io.helidon.tracing.Span Operations
| Method | Purpose | OK? |
|---|---|---|
close() | Close the scope. | - |
isClosed() | Reports whether the scope is closed. | ✓ |
io.helidon.tracing.Scope Operations
| Method | Purpose | OK? |
|---|---|---|
asParent(Span.Builder) | Sets this context as the parent of a new span builder. | ✓ |
baggage() | Returns Baggage instance associated with the span context. | ✓ |
spanId() | Returns the span ID. | ✓ |
traceId() | Returns the trace ID. | ✓ |
io.helidon.tracing.SpanContext Operations
Adding a Listener
Explicitly Registering a Listener on a Tracer
Create a SpanListener instance and invoke the Tracer#register(SpanListener)
method to make the listener known to that tracer.
Automatically Registering a Listener on all Tracer Instances
Helidon also uses Java service loading to locate listeners and register them
automatically on all Tracer objects. Follow these steps to add a listener
service provider.
- Implement the
SpanListenerinterface. - Declare your implementation as a service provider:
- Create the file
META-INF/services/io.helidon.tracing.SpanListenercontaining a line with the fully-qualified name of your class which implementsSpanListener. - If your service has a
module-info.javafile add the following line to it:provides io.helidon.tracing.SpanListener with <your-implementation-class>;
- Create the file
The SpanListener interface declares default no-op implementations for all the
methods, so your listener can implement only the methods it needs to.
Helidon invokes each listener’s methods in the following order:
| Method | When invoked |
|---|---|
starting(Span.Builder<?> spanBuilder) | Just before a span is started from its builder. |
started(Span span) | Just after a span has started. |
activated(Span span, Scope scope) | After a span has been activated, creating a new scope. A given span might never be activated; it depends on the code. |
closed(Span span, Scope scope) | After a scope has been closed. |
ended(Span span) | After a span has ended successfully. |
ended(Span span, Throwable t) | After a span has ended unsuccessfully. |
Order in which Helidon Invokes Listener Methods